
Table of Contents
Nearly two decades ago we started hearing predictions that music streaming, and specifically loudness normalization, would end the loudness war. The rationale was sound: loudness normalization evens the playing field by adjusting playback levels so that all songs sound similarly loud when played back-to-back in a playlist. This, in turn, reduces the pressure to make your latest record as loud as, or louder than, everything else – at least as long as it’s above the normalization reference level.
So, were the prognosticators right? Are top commercial hits actually being mastered to lower integrated LUFS levels? Short answer: not really – the top 20 averaged -8.1 LUFS, almost exactly where they sat in 2024.
In this article, we’ll take a look at the top 20 songs on the Spotify Top 50 – Global chart from October 4, 2026 to see – and hear – what we can learn about the state of the industry. You can listen along here.
A few quick notes before we start. If you’re unfamiliar with the concept of “the loudness war,” Wikipedia has a good overview. Additionally, 20 songs is an admittedly small sample size and tells us very little about long-term trends over the last few decades, however it still gives us an interesting snapshot. Plus, as you’ll see, the picture it paints is not as monotonic as you might expect.
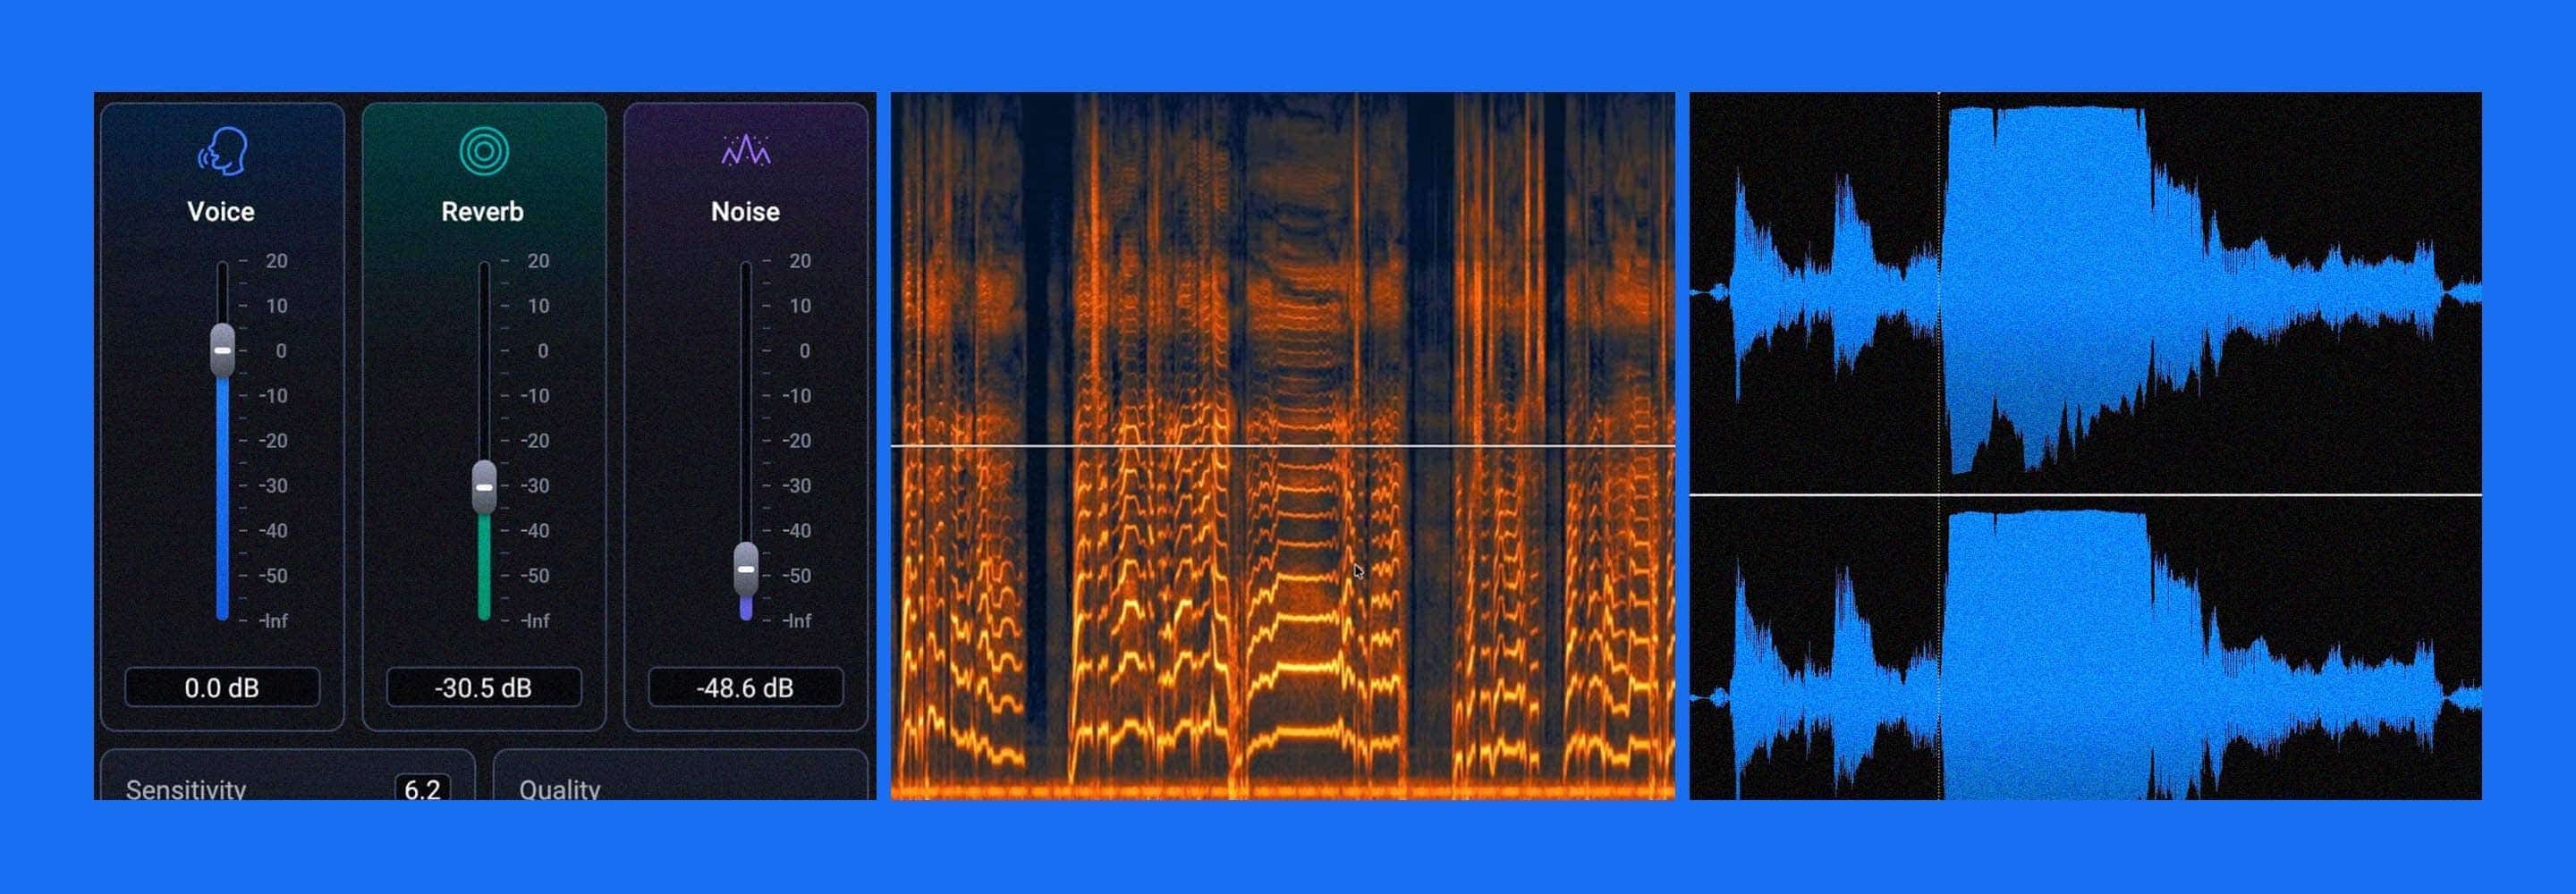
Follow along with this analysis using RX 12.
Is the loudness war over?
So, is the loudness war over? Well, to use an answer many of my Berklee students will be familiar with: “it depends.” Specifically, it depends on what you imagine the end of the loudness war looking like.
If you imagine it looking like everybody suddenly mastering at substantially lower LUFS levels, then no, it is emphatically not over – details below. Or, if you imagine it as a complete cessation of arguing over how loud things need to be, also no – just go visit your favorite audio engineering subreddit/Facebook group/YouTube channel/etc. After all, as they say, opinions are like…
However, if you imagine it looking like not having to worry too much about just how loud your latest release is, and instead focusing on making it just sound as good as possible, then maybe, just maybe, the loudness war kind of is over.
As a bit of a side-note, I think this underscores some of the implicit biases we all tend to carry when thinking and talking about nearly any topic we care about. If you are biased toward preferring music mastered at high levels, with high density and low micro-dynamics, then you may be likely to say something like, “the loudness wars are over, and loudness won!” Whereas if you’re biased toward lower levels and density, and higher micro-dynamics you may say, “the loudness wars are over and normalization makes it clear that more dynamic music sounds better!”
Yet both of those are value judgments, and ultimately music is art. So, while I can tell you what I personally prefer, neither I, nor anyone else – in my humble opinion – can tell you what is better or worse, either for you, or for anyone else.
Ok, a little philosophizing out of the way, let’s look at something a little more objective.
Are modern songs getting quieter on Spotify?
In short, no – this year’s top 20 average -8.1 integrated LUFS, essentially unchanged from 2024. And also, they’re not getting continually louder. To refresh your memory from my 2024 analysis, the average integrated loudness was -8.3 LUFS ±1 LU, with a maximum of -6 LUFS, and a minimum of -11.1 LUFS. In this sample of 20 songs, we see something very similar: an average of -8.1 LUFS ±1.5 LU, with a maximum of -5.1 LUFS and a minimum of -11.1 LUFS.
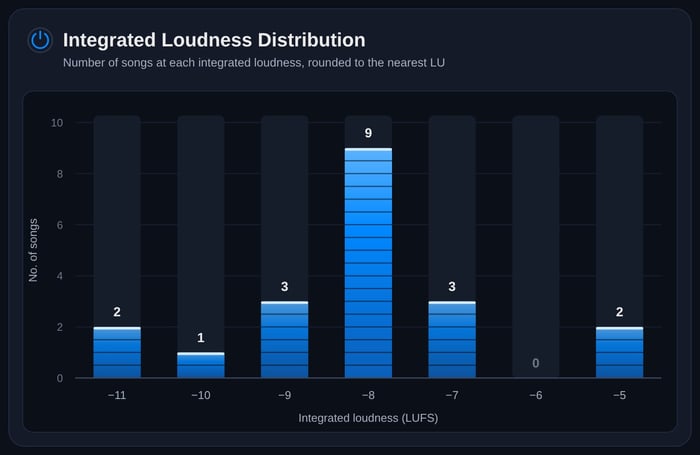 Distribution of the integrated LUFS of the top 20 songs under analysis
So, while we do have a few that are a little louder than anything in the 2024 analysis, there are also a few more below the center point – albeit more widely distributed. What’s more, two of the three softest were released in the last few years:
- “Nicole Kidman” by ADÉLA, -10.0 LUFS, released Sept. 4, 2026, no. 2 on the chart
- “Die With A Smile” by Lady Gaga and Bruno Mars, -11.1 LUFS, released Aug. 16, 2024, no. 20 on the chart (although up to no. 10 as of this writing)
Does loudness affect chart success?
Perhaps more interestingly, we can examine something else we’ve seen in the data for decades, even pre-streaming: loudness doesn’t predict success.
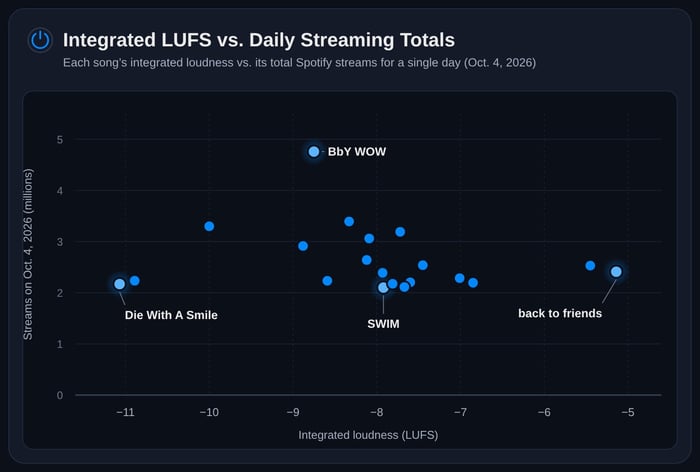 Integrated LUFS vs. daily streaming totals
This has been true for about as long as we’ve been able to measure this sort of thing, and it points to the fact that fans just really don’t care that much about, or even particularly notice differences in loudness. That may be even more true now that normalization has made the differences in loudness even smaller.
Why do top songs still sound loud if they get turned down?
The answer to this is genuinely nuanced and complex. The short version: normalization matches songs by integrated LUFS, but that single number can’t hear arrangement, density or micro-dynamics, so two songs at the same level can feel very different. Covering it all is probably beyond the scope of this article – heck, it’s almost beyond the scope of my 400-level college classes – but we can start to take a peek at some of the key details.
On Spotify's default setting, every one of these 20 songs gets turned down. That runs from 2.9 dB of attenuation for “Die With A Smile” to 8.9 dB for “back to friends” by sombr – the hottest master in the set at -5.1 LUFS. In theory, they should all sound about equally loud. Right? This is where I tell my students, “meters will lie to you! They don’t understand arrangement!!” We’ll get on to more around that, but let’s start by listening to what happens to drums when you push the average level 6 dB higher.
Those two songs make a good first comparison. They're the loudest and softest masters of the bunch, separated by almost 6 LU, as mastered. Once normalized to -14 LUFS, “Die With A Smile” sounds much punchier to me, with a lot more articulation in the drums – in other words, more micro-dynamics. Its loudest moments also come across as a little further forward, though that difference is smaller than the difference in punch and transient separation.
Listening cues
- “back to friends” [1:46]: listen to the kick and snare. How much of each hit stands apart from everything around it?
- “Die With A Smile” [3:32]: same question, same drums-forward focus. Then compare how far forward each chorus feels.
Ok, so why do some songs feel louder than others, or some moments of some songs feel louder? Why are the meters lying to us?!
Integrated LUFS boils an entire song down to a single number, but it isn't a simple average. Amongst other things, it uses a relative gate: any Momentary – 400 ms – block more than 10 LU below the ungated average is left out of the measurement. That's part of what keeps a long, quiet intro or a fade-out from dragging the number down.
“stupid song” by Olivia Rodrigo is a great example of how this can impact a song’s integrated LUFS.
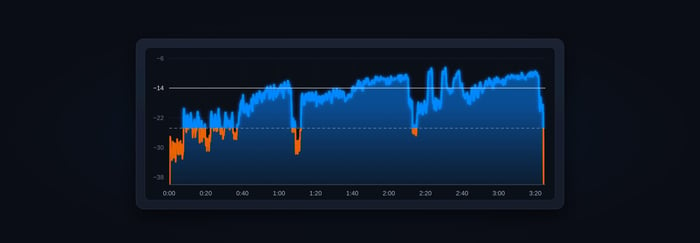
It starts with just piano and vocal and builds to a full-on ending, with an LRA of 14.4 LU – the widest in the set. We can analyze this with the Loudness Optimize module in RX, and see that 17% of it falls below the gate. We can compare that to “Earrings” – beat-driven, with a more uniform arrangement and an LRA of 2.9 LU – where 98% of the song is above the gate. As an aside, most of the LRA difference is simply arrangement rather than processing.
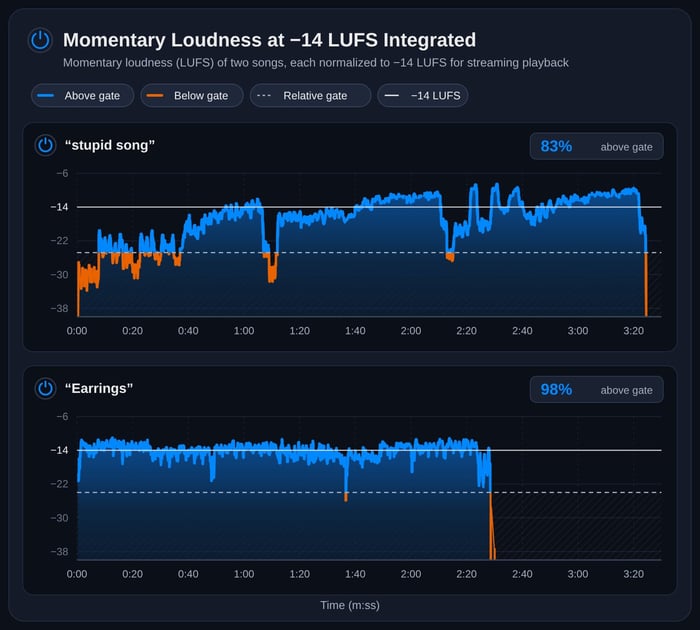 Momentary loudness vs. relative gate of “stupid song” and “Earrings”
The result is a little counterintuitive, and again, nuanced.
First, we should focus on how “stupid song” actually comes across from start to finish. Listen to the stripped back piano and vocal intro. Then listen to the big, full-on ending. Does the end sound as much louder than the intro as it should? Focus on the vocal level and compare whether it’s gotten louder, softer, or stayed the same. Most of this is probably down to arrangement and mix – although certainly there’s an opportunity to automate these things in mastering.
Next, let’s compare how different sections of “stupid song” sound next to “Earrings” – a song with much more even macro-dynamics (the level changes between sections, as opposed to micro-dynamics, the punch of individual hits). To my ears, the softest parts of “stupid song” sit at about the same level as “Earrings.” Meanwhile, its loudest moments, which measure 2.5 LU above the loudest moment of “Earrings,” don't actually sound anywhere near that much louder. What gives? This is really a prime example of how meters do not understand arrangement or context. The meters are simply measuring weighted total energy, but they have no idea what is contributing to that energy.
And, here's the doubly ironic part: if you raised the soft sections of “stupid song” enough to clear the gate, A) more of the quiet parts would count toward the average, lowering it, but B) it would feel – in my opinion – even less musically “right” than it does now, with soft sections that end up feeling much louder than loud sections. In other words, just because something measures “better” doesn’t necessarily mean it sounds more musical.
A little more detail: raising soft sections above the relative gate would pull the integrated measurement down by almost 0.5 LU in this case, and so Spotify would turn the song down about 0.5 dB less. Louder quiet parts – and thus a lower integrated loudness number – means the whole thing gets turned down less and so the quiet parts end up even sounding louder than the loud parts of other songs.
Huh?! Can that possibly be right?! Whether or not you or I agree with it, that is how the spec works. As I've said before, LUFS measurements and loudness normalization aren't broken, they're just slightly imperfect systems.
Honestly, there are more side-alleys we could explore from this set of 20 songs – acoustic advantage, macro-dynamics vs. micro-dynamics, track vs. album normalization – but so as not to melt too many brains, let’s save those for another time!
Do chart-topping songs still push close to 0 dB True Peak?
Yup, and in many cases they exceed 0 dBTP! Out of this set, we see True Peak values between -0.4 and +1.8 dBTP. While we can’t know for sure where True Peak limiting was used, we can say with confidence that it was not used on more than half of them, where True Peaks exceed 0.
If, instead, we look at sample peak levels, we see one at -0.9 – so not even sample peaks are kept at or below -1 – with the rest of them falling between -0.5 and 0.0 dBFS, and four right up at full scale. Personally, my True Peak philosophy has not changed much in the last three years, but clearly there’s plenty of room for interpretation without impacting commercial success.
One interesting trend that did come out of this data – with full acknowledgement that it could be a fluke due to the size of the sample set – is that there’s a slight downward slope when comparing maximum True Peak level to release date.
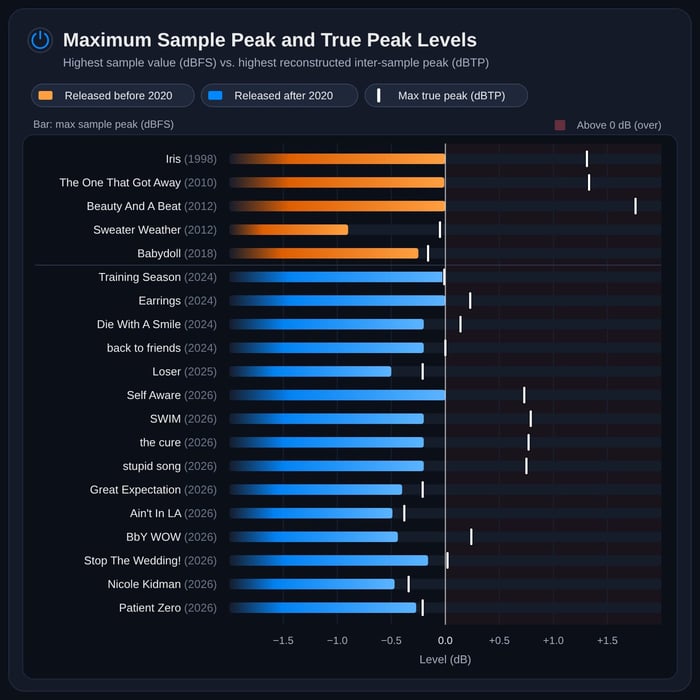 Maximum sample (dBFS) and True Peak (dBTP) levels by release date
In the chart above the pre/post 2020 split was chosen as that was the year Spotify switched from ReplayGain to LUFS-based normalization, but of note, the oldest song predates Spotify itself by a decade. My suspicion is that if this tells us anything, it’s more about improvements in our tools – modern limiters – than specific technical or artistic choices.
Start listening beyond the numbers
So, are top Spotify hits actually getting quieter? Not really, and maybe that’s not what the end of the loudness war was ever going to look like. This set of 20 songs averages -8.1 LUFS – right in line with what I found in 2024 – with plenty of spread on either side. Perhaps more importantly, there’s no sign that absolute level decides which songs end up on the chart.
Peaks haven’t backed off much either, with more than half of these songs going over 0 dBTP. What has changed is what that level gets you. Once normalization turns everything down, what’s left is arrangement, mix, dynamics, density – the things a single integrated LUFS number can’t thoroughly capture. To me, that’s the real end of the loudness war: you get to choose, and then listen to the result.
If you want to see how your own masters behave once they’re normalized, Streaming Preview in RX 12 can help with level, codecs and more, and if you want to dig deeper, Loudness Optimize can show you exactly how much of a song falls above and below the gate – just proceed with caution and let your ears, not the numbers, lead the way. Download a free demo of RX and take a look.
FAQs
Is the loudness war over?
It depends on how you define it. Hit songs aren’t being mastered much quieter. The top 20 Spotify songs from October 4, 2026 averaged -8.1 LUFS. But loudness normalization means a louder master no longer gets you a louder playback level, so engineers can focus on how a song sounds rather than how loud it is.
How loud are top Spotify songs mastered in 2026?
In this sample, integrated loudness averaged -8.1 LUFS ±1.5 LU. The loudest master was -5.1 LUFS and the quietest was -11.1 LUFS, nearly identical to the 2024 average of -8.3 LUFS.
How much does Spotify turn down loud songs?
On its default setting, Spotify normalizes tracks to -14 LUFS. Every song in this top 20 was turned down, by anywhere from 2.9 dB to 8.9 dB.
Why do some songs sound louder than others after normalization?
Integrated LUFS reduces a whole song to one number and leaves out quiet passages through a relative gate: any 400 ms block more than 10 LU below the ungated average is ignored. Arrangement, density and micro-dynamics also shape how loud a song feels, and a meter can’t account for any of them.
What’s the difference between macro-dynamics and micro-dynamics?
Macro-dynamics are the level changes across a song, like a quiet intro building to a loud chorus. Micro-dynamics are the short-term contrasts, like how much a kick or snare hit stands out from what’s around it. After normalization, songs with more micro-dynamics often sound punchier.
Do hit songs keep true peaks below -1 dBTP?
Mostly not. True peaks in this set ranged from -0.4 to +1.8 dBTP, and more than half went over 0 dBTP.
Does a louder master help a song chart?
No. Integrated loudness showed no relationship with daily streams in this data, which matches what’s been seen for decades.
How can I check how my master will sound on Spotify?
Streaming Preview in RX 12 lets you hear your master at streaming levels and through streaming codecs. Loudness Optimize shows how much of a song falls above and below the relative gate.