Understanding spectrograms
What is a spectrogram and how do they work? Learn how to read a spectrogram and begin understanding important information about your audio.
There are countless audio analyzers out there that tell us information about the audio we're working with from peak volume and dynamic range to stereo spread and more. The one thing most of these tools have in common is that they provide this information to us in a visual way, sometimes with numbers and sometimes with graphs.
Spectrograms are one of these tools. What are spectrograms and what kinds of information do they tell us? Read on to find out!
Follow along with this tutorial using iZotope RX 11.
What is a spectrogram?
Spectrograms are visual representations of audio – representing time, frequency, and amplitude all on one graph. They visually reveal audio problems by sight, like broadband, electrical, or intermittent noise, which can help us make decisions with mixing music or editing sound. Because of its profound level of detail, a spectrogram is particularly useful in post production – so it’s not surprising that you’ll find one in tools like iZotope Insight and RX.
Spectrogram vs. waveform
In audio software, we’re accustomed to seeing a waveform that displays changes in a signal’s amplitude over time. A spectrogram, however, displays changes in the frequencies in a signal over time. Amplitude is then represented on a third dimension with variable brightness or color.
Let's take a look at an audio file in a traditional waveform view and a spectrogram. First, here’s a sine wave moving up in pitch from 60 Hz–12 kHz, as seen in a traditional waveform:
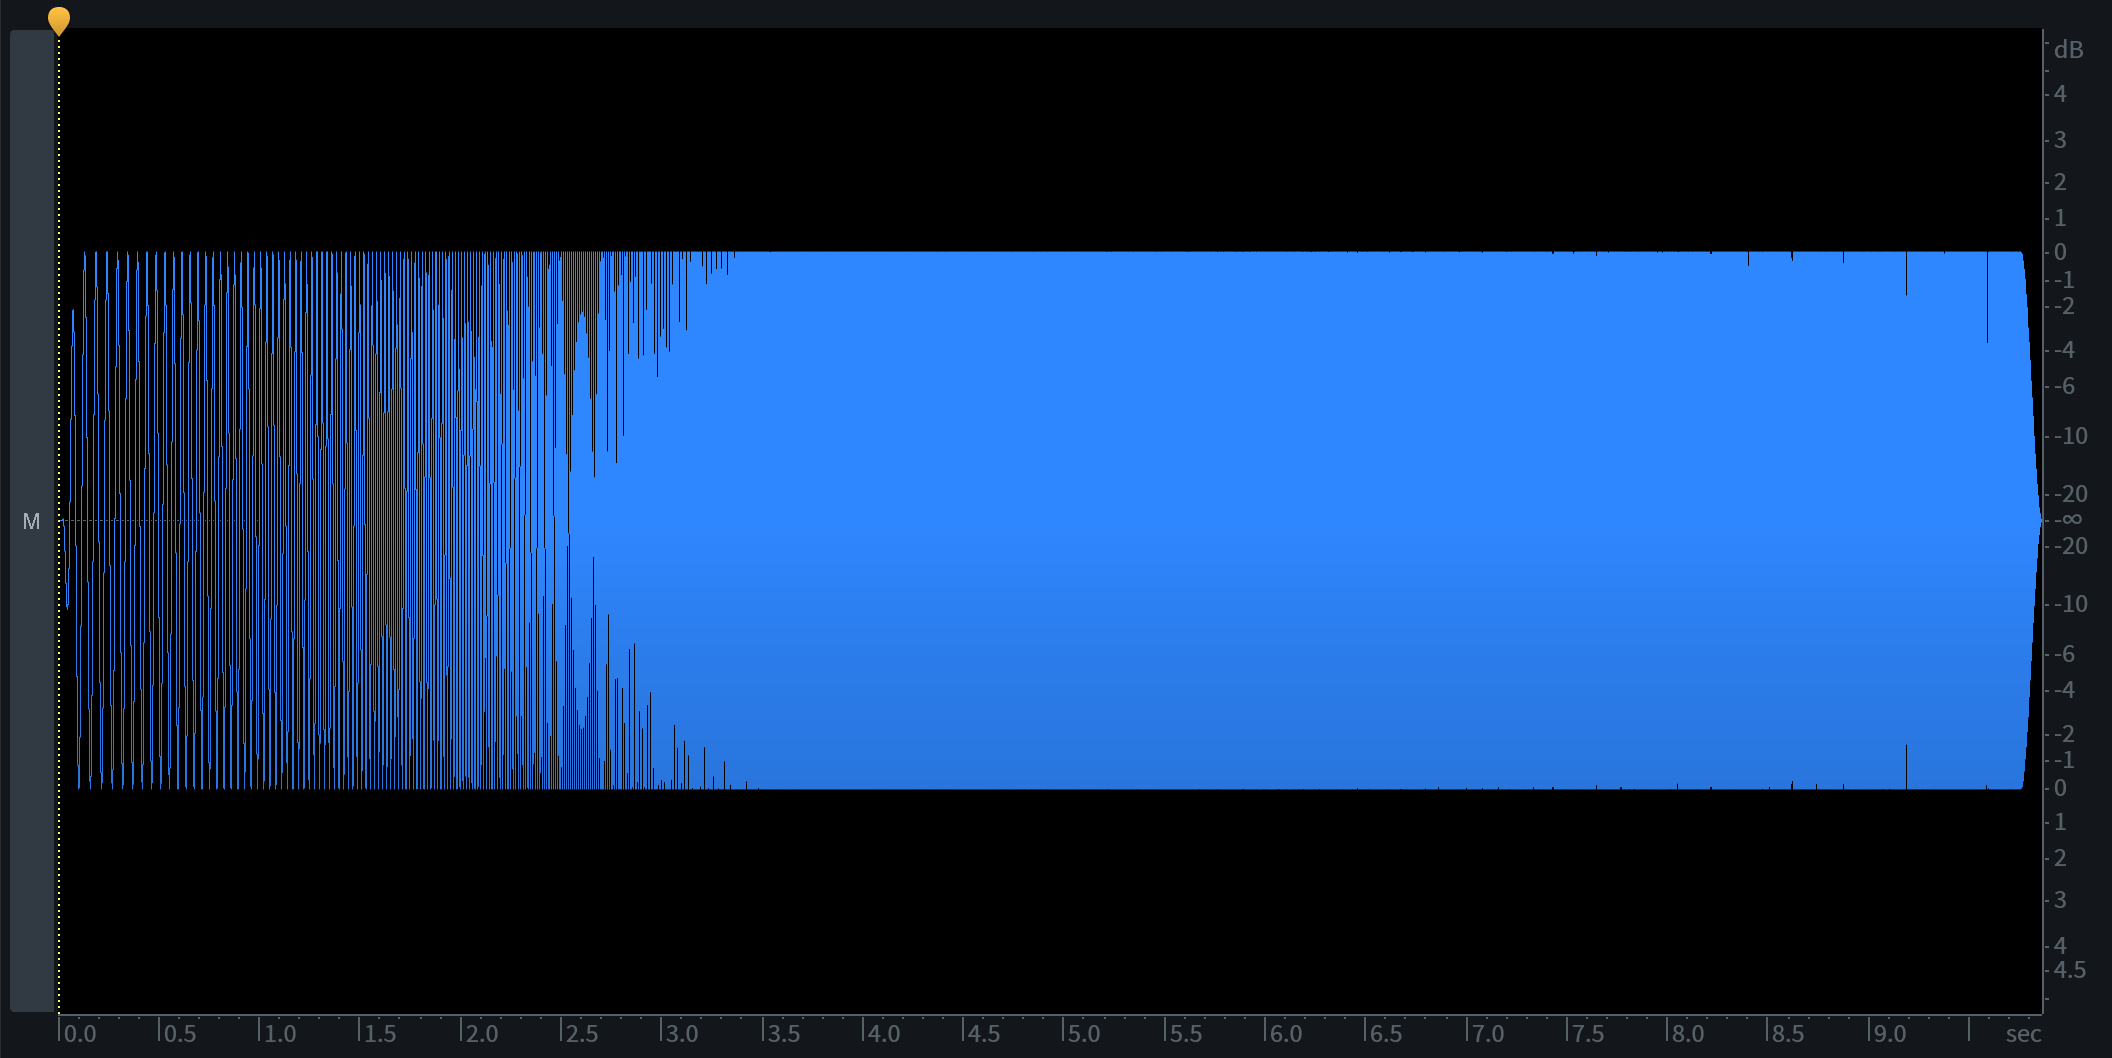
Pitching sine wave shown as a traditional waveform
You’ll notice that the waveform shows amplitude over time, but we can’t really see what’s happening at individual frequencies. We can see that the sine wave is at a consistent level for the duration of the file, but we can’t tell much about how the pitch or frequency changes over time.
Here is the same audio file using a spectrogram.
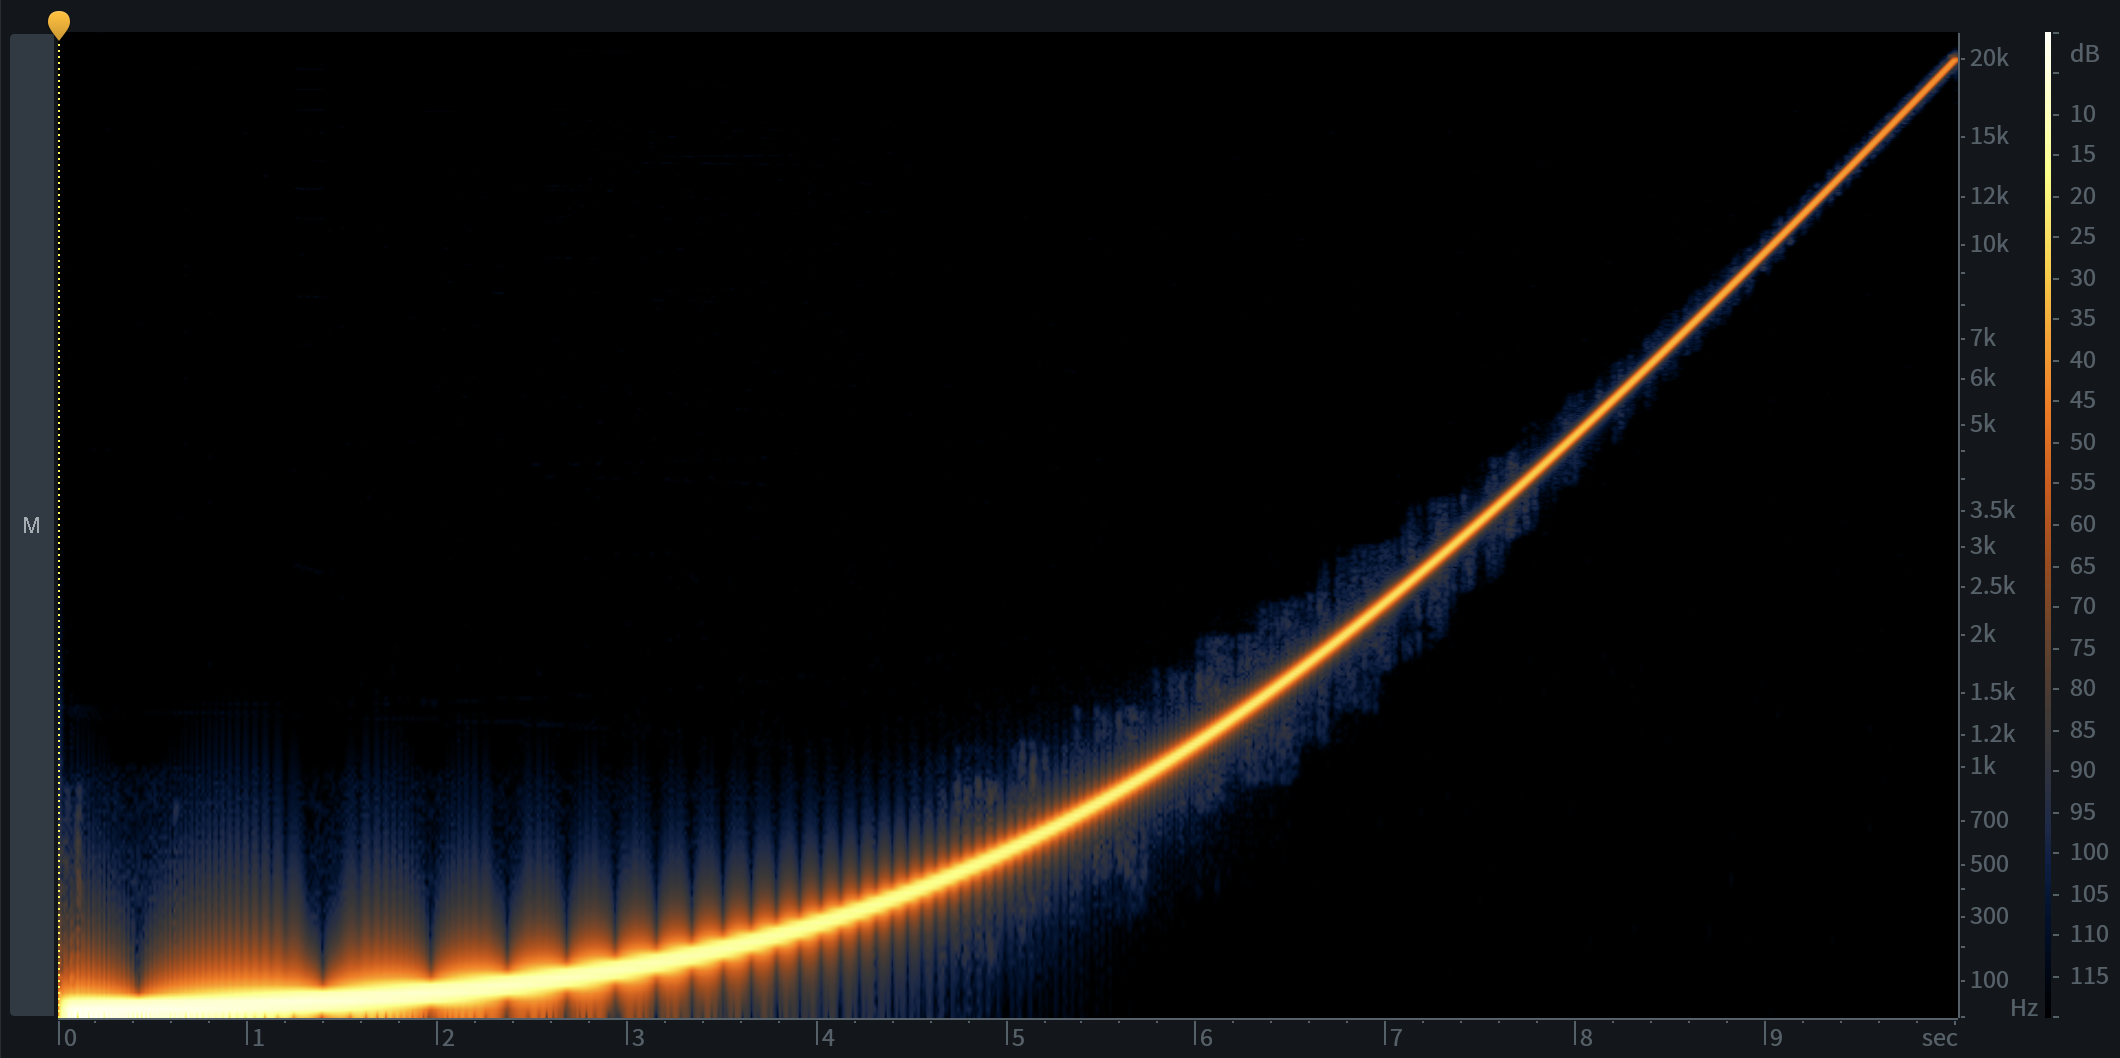
In the spectrogram view, the vertical axis displays frequency in Hertz, the horizontal axis represents time (just like the waveform display), and amplitude is represented by brightness.
The black background is silence, while the bright orange curve is the sine wave moving up in pitch. This allows us to view a range of frequencies (lowest at the bottom of the display, highest at the top) and how loud events at different frequencies are. Loud events will appear bright and quiet events will appear dark.
Now, let’s look at a more complex audio example: the human voice.
Here’s a short, spoken phrase as seen through a waveform display. What we see here is the amplitude of the spoken words over time.
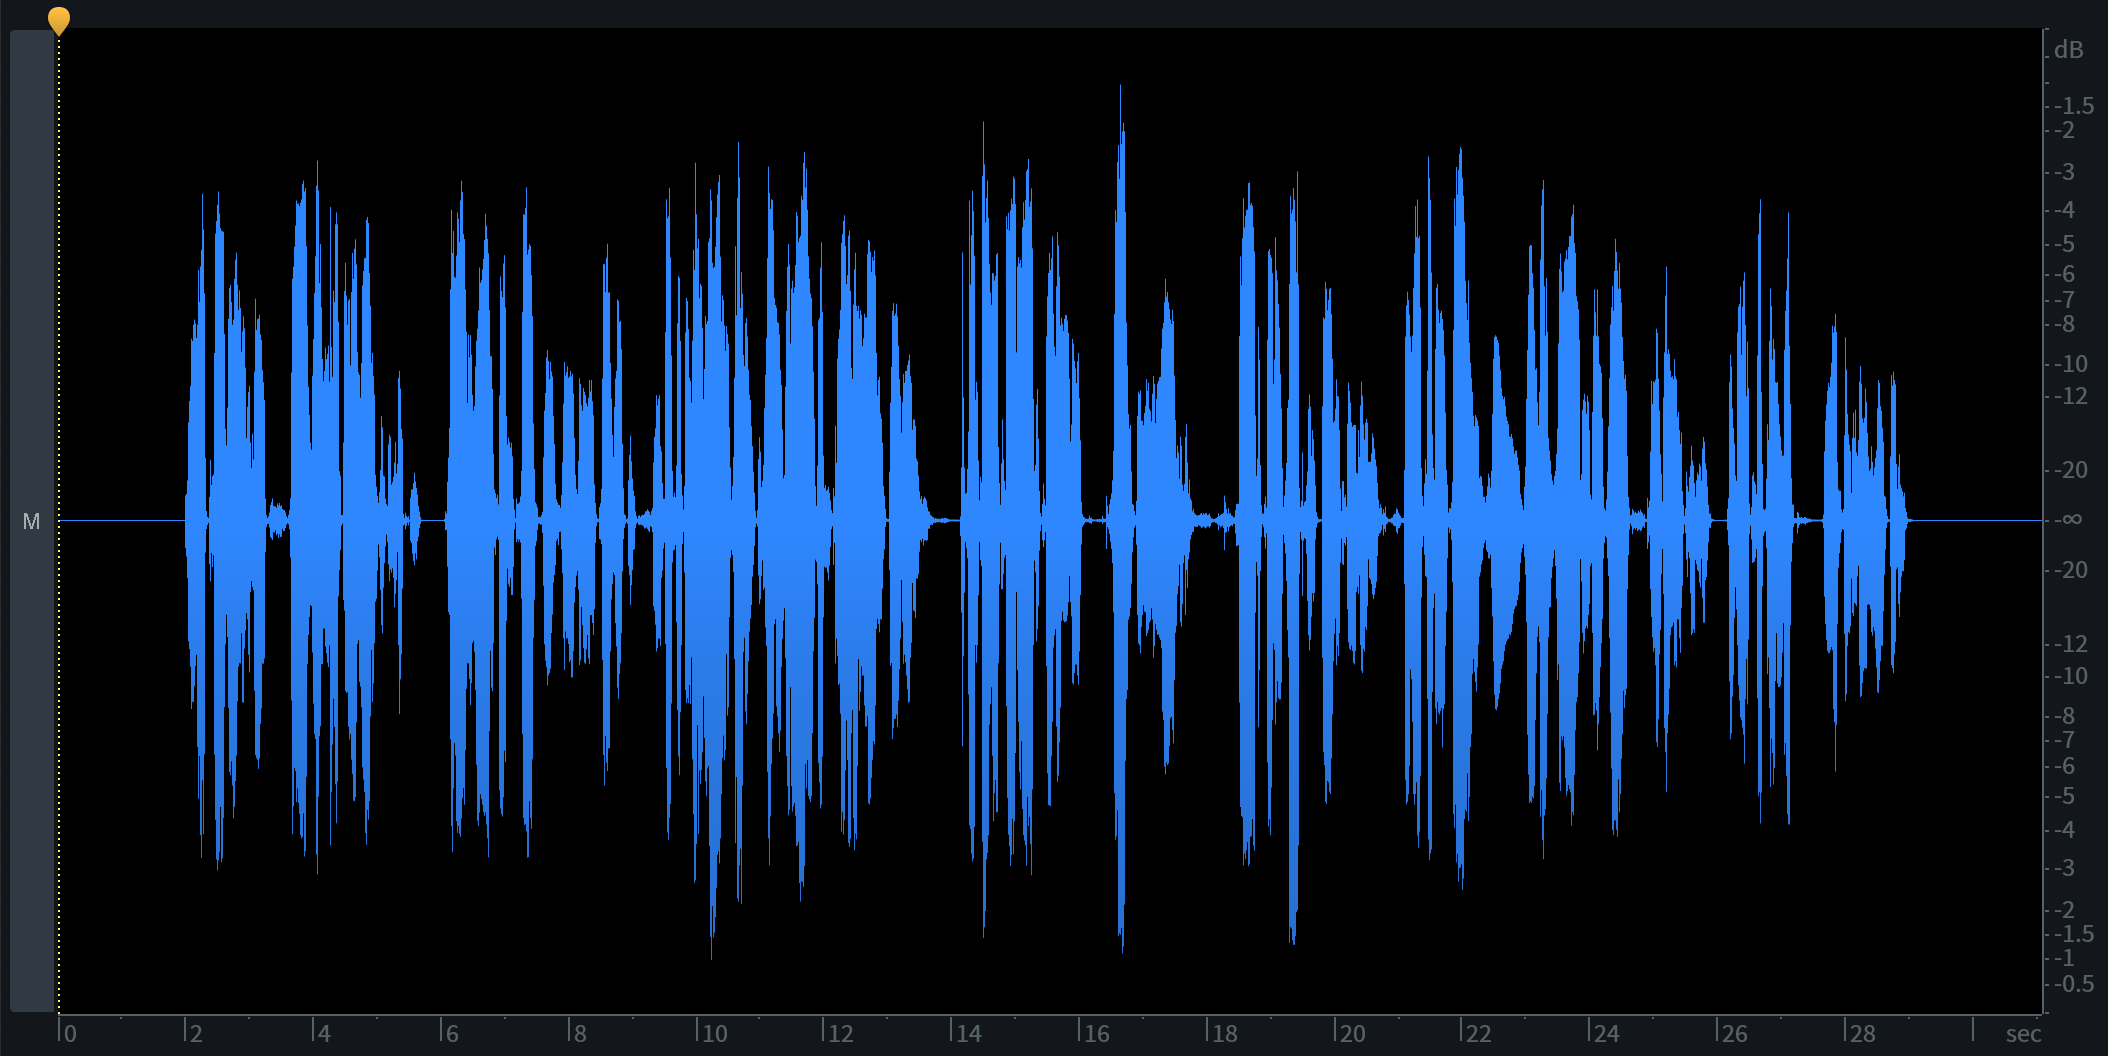
Dialogue shown as a traditional waveform
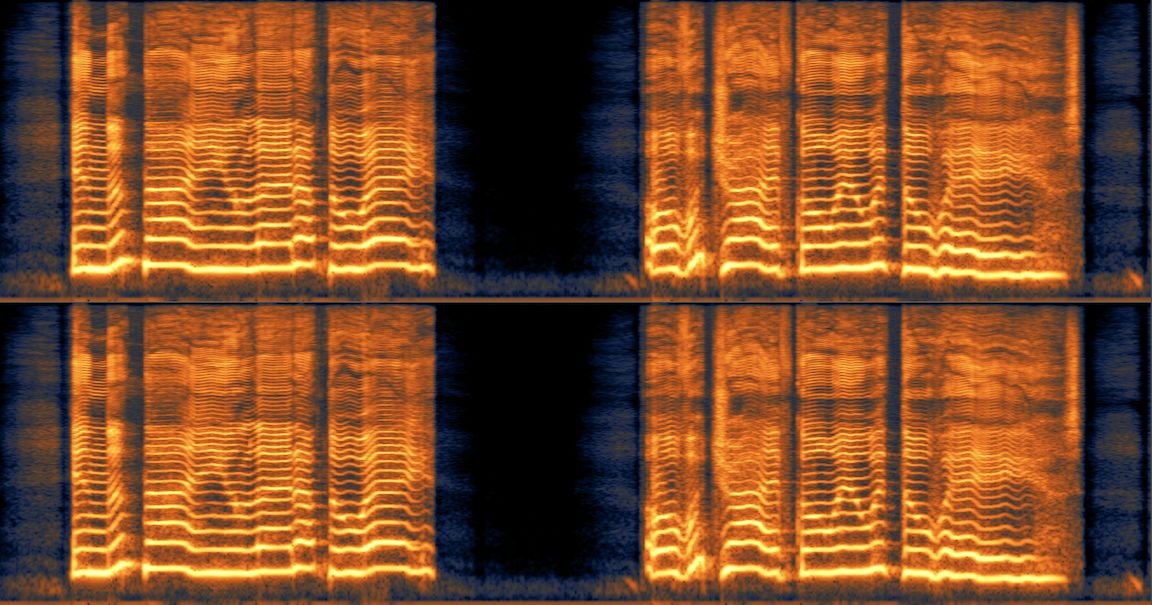
If we switch to the Spectrogram view, we’ll see many things we can’t see in the Waveform view.

Dialogue shown in a spectrogram
This is why having a detailed spectrogram display is so important in audio editing: it helps to clearly display the problems that you might want to fix.
The key to successful audio restoration lies in your ability to correctly analyze the situation—much like a doctor recognizing symptoms that point to a certain illness.
Constantly training your ear to distinguish the noises and audio events that need to be corrected can be a life-long endeavor. Fortunately, as explained previously, spectrogram technology makes this task easier by representing those audio events visually.
Spectrogram/Waveform displays in RX
RX features an advanced spectrogram display that is capable of showing greater time and frequency resolution than other spectrograms, allowing you to see an unprecedented level of detail when working with audio.
An overview of the entire audio file's waveform will be displayed above the main Spectrogram/Waveform display in a Waveform Overview. The Waveform Overview will always display the entire audio file and will also display any selections made in the main display.
You can also view the traditional waveform, or a blend of both, by adjusting the Waveform/Spectrogram Opacity slider to the left just below the spectrogram.
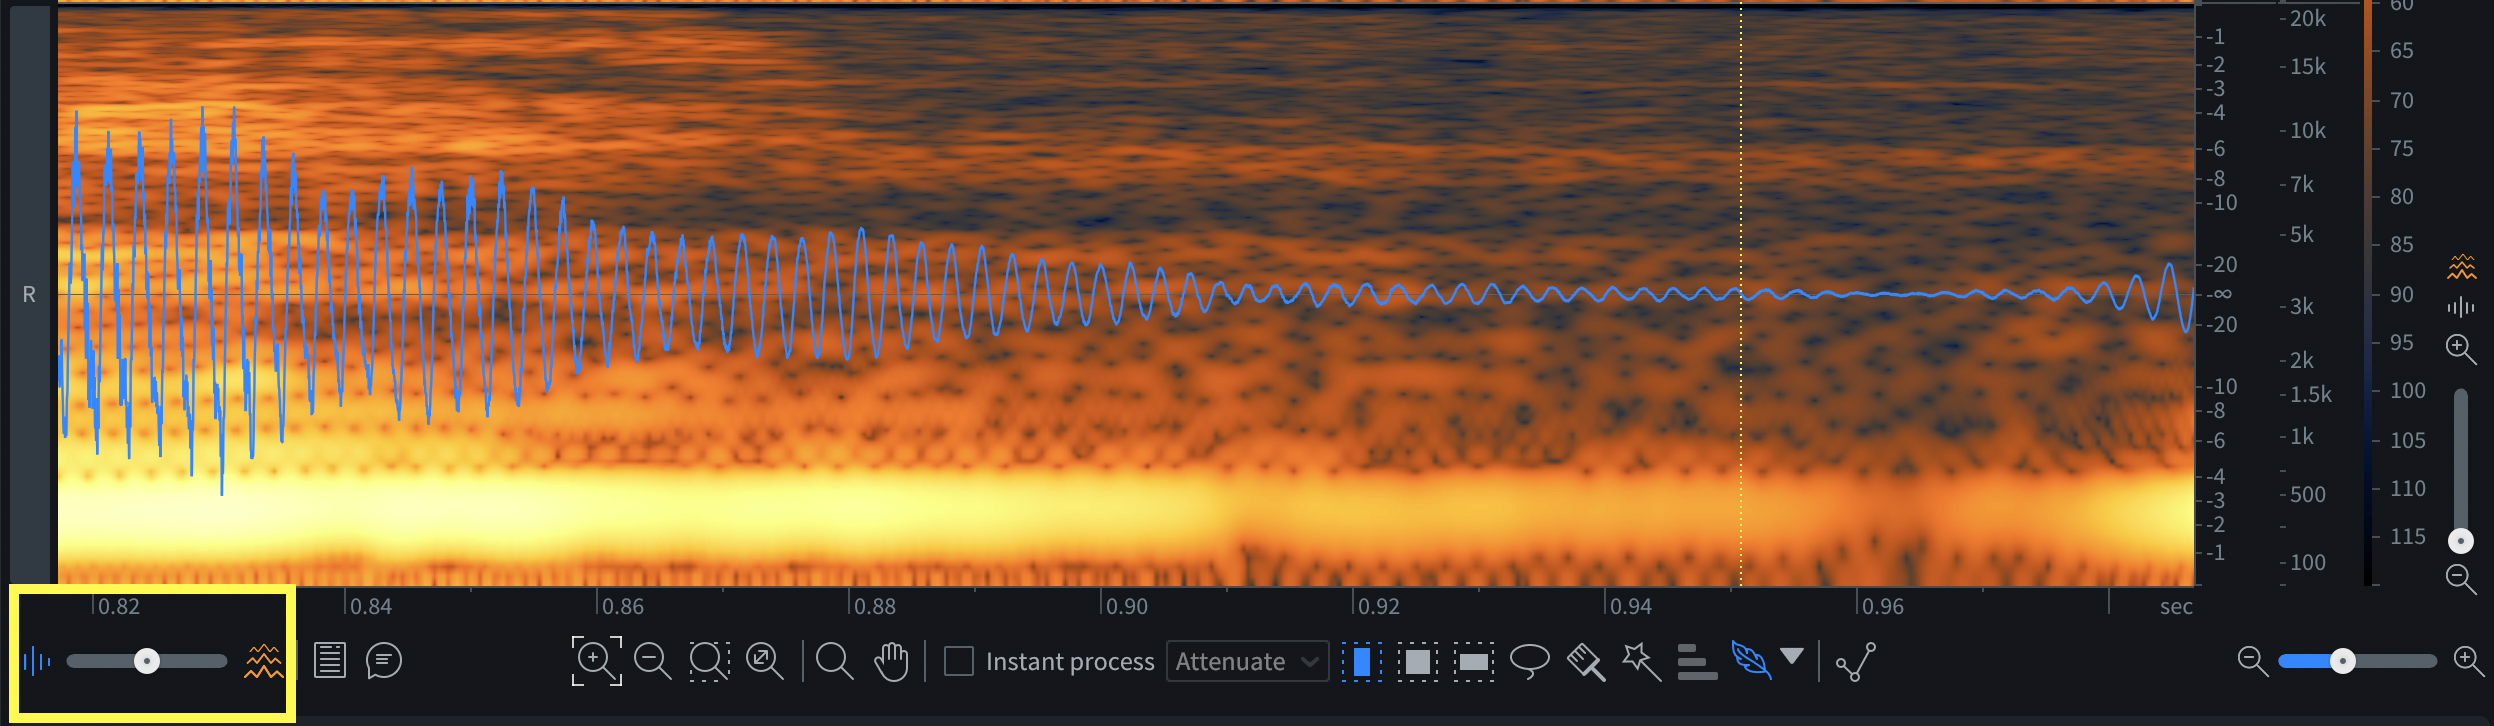
Waveform/Spectrogram Opacity slider
The aim of any good visualization tool for audio repair and restoration is to provide you with more information about an audible problem. This not only helps inform your editing decisions, but, in the case of a spectrogram display, can provide new, exciting ways to edit audio—especially when used in tandem with a waveform display.
How to fine-tune the display
Not all spectrograms are created equal. An algorithm known as the “Fast Fourier Transform,” or FFT for short, is used to compute this visual display. Many plug-ins that feature a spectrogram display allow you to adjust the size of the FFT, but what does this mean for audio repair and restoration? Changing the FFT size will change the way the algorithm computes the spectrogram, causing it to look different. Depending on the type of audio you’re working with and visualizing, changing the FFT size may help.
As a rule, higher FFT sizes give you more detail in frequencies, referred to as frequency resolution, while lower FFT sizes give you more detail in time, referred to as time resolution.
If you’re trying to identify a plosive, mic handling noise, or other muddy low-frequency information, a higher FFT size in your spectrogram settings will help. If you’re trying to identify a high frequency event, or working with a transient signal (such as a percussion or drum loop), choose a lower FFT size.
Using the spectrogram to solve audio problems
There are a number of different audio problems that the tools in RX can help you fix. Identifying what kind of problem you have can help determine the most appropriate tool and method for treating the problem.
We’ve collected tips to help you identify seven common types of audio problems in a spectrogram, plus the modules in RX to remove them quickly and effectively. The audio problems we’ll be covering are:
- Hum
- Buzz
- Hiss and other broadband noise
- Clicks, pops, and other short impulse noises
- Clipping or distortion
- Intermittent noises
- Gaps and drop outs
Hum
Hum is usually the result of electrical noise somewhere in the recorded signal chain. It’s normally heard as a low-frequency tone at either 50 Hz or 60 Hz.
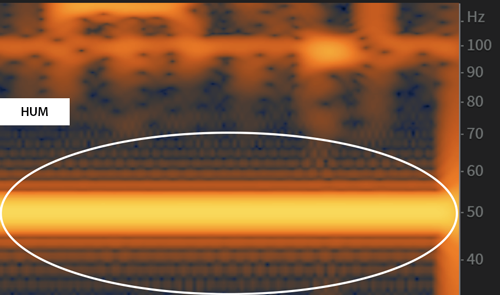
Hum shown on a spectrogram